Optimization of chemical industry: CHEMOPETROL Inc.
![]()
The case study in pdf you can download here.
APPLICATION:
The material flow optimization
BRANCH:
The plastics production
BENEFIT:
Using the dynamic simulation there were found bottlenecks in the production process in the period from april to december 2012. There were proposed different options to remove bottlenecks at increasing a capacity of a production facility.
About the company
The trading company CHEMOPETROL Inc. is the part of the concern UNIPETROL Inc. The majority owner of UNIPETROL Inc. from the year 2005 is the company PKN ORLEN. CHEMOPETROL Inc. products thermoplastic material as polyethylen and polypropylen which are mainly used in the production of injected molded products and plastic films.
Project targets
The project target was to verify a continuity of the material flow of the plastics production (PE, PP) in variants according to the combination of input paramatres. The verification of the continuity of the material flow with the goal of finding of bottleneck in the whole production process and mainly in the storage there was demanded by CHEMOPETROL Inc. because of the increase in the production capacity of plastics (PE and PP).
Project solution
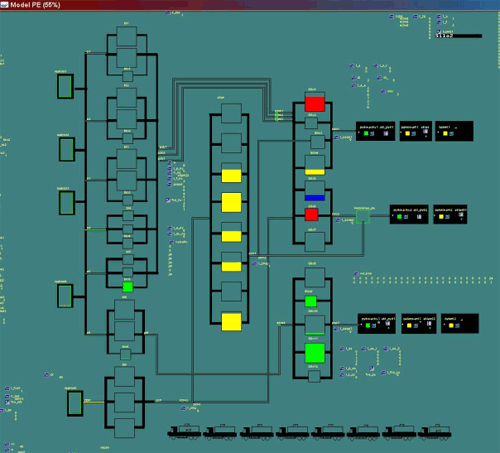
The picture of the model

The whole project was processed with the support of the dynamic simulation method. There was created the virtual model of the whole process, i.e. the production of plastics (PE, PP), the production in reactors, transport, packaging, storage and the final dispatching of freely bulk (in car-tanks), packaging in bags, on pallettes and transported by camions. The whole simulation took place the whole year or in the period from April to December of the year 2002.
By the verification of future developement variants it was found the most presumable variant and results of this variant create the outputs for the removing bottlenecks which are appeared at increasing of the production facilities capacity. These variants were proposed on the basis of the first presentation of results of all the originally defined variants of the possible development.
On the basis of removed bottlenecks there were proposed the changes in the number of storage silos, the changes in needed storage space and the variant solution of these parametres and depend on amount of unbagged material because some of customers want the bulk material in car-tanks
There were simulated these variants in this project:
The 2002 production – the simulation on the basis on gained data about the production and sale PE in this year, the part of bulk material was 25% a 40%.
The maximal production – The simulation for PE took place in these combinations:
- The Sale instructions uniform, 30% of bulk material, the campaign of 5th reactor 3 months,
- The Sale instructions uniform, 40% of bulk material, the campaign of 5th reactor 3 months,
- The Sale instructions uniform, 30% of bulk material, the campaign of 5th reactor 2 months,
- The Sale instructions uniform, 40% of bulk material, the campaign of 5th reactor 2 months,
- The sale decreases in December, January, July, August by 20%, 30% of bulk material,
- The sale increases in the period of that type by 20 %, 30% of bulk material,
- The bulk material 40%, the sale fitfully decreases by 20%, at the time of the type production the sale of packaging goods increases by 20%.
The maximal production – the simulation for PP took place in these combinations:
- The Sale instructions uniform,
- The increase of bulk material by 10 %,
- The sale decrease in January, July, August and December by 20%,
- The sale increase by 20% at the type production,
- % of bulk material according the specification, the production parametres are the same, the sale fitfully decreases by 20%, at the production of the type the sale of packacged goods increases by 20%.
Results
From these variants were chosen the most real, i.e. which take into account the combinations of all influences which coul be during the production (decreases, increases during the year). Within the maximum variant simulation was verified a possibility of decreasing the number of concurrently using bag machines.
On the basis of simulation results were determined curves which show type levels at the warehouse and depend on de-bagged material amount, the added silos, graphs of utilization of packaging, pallet and bag machines.
For the most real simulated variants of maximum production was determined the maximum size of the packaged material warehouse. For these variants was verified move at the packaged material warehouse using the addition of 30 silos for PE and 20 silos for PP. At this simulation the maximum values were reduced.
From the production simulation in 2002 was found out the maximum level at the packaged goods warehouse.